The Table He Copied
and the Table He Made
In 1662 a London haberdasher named John Graunt bought up the weekly bills of mortality, added them together, and invented the reading of population from records of the dead. His book prints two great tables. One he assembled by hand from twenty years of parish clerks' returns. The other he worked out from a rule. This page adds up both of them, in your browser, from a keyboarded transcription of the first edition, and the difference between them turns out to be legible in the arithmetic.
The bills were a weekly sheet. Each parish clerk in London returned the burials in his parish, with a cause of death against each one, and the causes came from the searchers of the dead: old women, paid a small fee, sent to look at a body and say what had killed it. Graunt knew exactly what that was worth. He devotes several pages to how far the searchers can be trusted, and concludes, roughly, that they are reliable about a few obvious things and guessing about the rest, which is a more careful statement about data quality than most of what was written for the next two hundred years.
What he then did with the sheets was new. He piled up twenty years of them and asked what the pile said. The tables below are the pile. Every number in them is a number a clerk wrote down, copied by hand into a manuscript, and set in type by a compositor in 1662, and at each of those three stages a digit can go astray. So: do they add up?
The table he copied
Graunt's Table of Casualties gives 81 causes of death against 22 single years, then six summary columns, then a grand total headed In 20 Years. Every one of those summary figures is a claim about the numbers to its left, and every one of them can be checked. Click any shaded cell and the cells it totals will light up, and the addition will be written out underneath.
The Table of Casualties, London, 1662
Pick a shaded cell above. Every figure written out below is added in this browser from the transcribed cells, not read from a stored answer.
Where the error travels
A wrong subtotal is only mildly interesting. What it is next to is the interesting part. Each row's grand total can be compared with two different things: the sum of the twenty individual years, and the sum of the five printed four-year subtotals. When a subtotal is wrong, those two disagree, and the grand total has to pick a side. Which side it picks says which numbers were actually being added.
There is a second signature in the failures. An addition botched at random can be wrong by anything. A digit mis-set in type, or mis-copied from one sheet to another, is wrong by a single digit in a single decimal place, so the error is 3, or 30, or 300, and almost never 47.
The cleanest of the failures is worth looking at in the print. Here are two adjacent lines of the sheet, Aged above and Ague, and Fever below, at the point where the eight early years give way to their two subtotals.

That is not a botched addition, and it is not a mis-set digit either: 2623 and 2475 share no digits to confuse. It is what happens when an eye running along a wide sheet takes part of one line for part of the next. There are two such pairs here, both between the same two rows, which is either one lapse repeated or one lapse that governed two columns.
The other table
The Table of Casualties is not the only one. Facing it is the Table of Burials and Christnings, which runs from 1604 to 1661 and splits each year's burials three ways: the 97 parishes within the walls, the 16 without, and the out-parishes. Those three should come to the fourth column, Buried in all. Every ninth row is an eight-year subtotal. Same treatment, same arithmetic, run in your browser on the same load.
Where the Table of Burials and Christnings fails
This is the one table of Graunt's that has been checked before, and checked better than we can check it here. Hull, in 1899, collated it against John Bell's London's Remembrancer of 1665, which prints the weekly returns Graunt was summarising, for the 17 years where Bell survives. Thirteen agreed. Of the four that did not, Hull concluded that the christening discrepancies of 1641 and 1642 were "obviously due to a transposition of figures, and the error is probably Graunt's". That is an external check against a second source, and it is a stronger instrument than anything on this page: we can only ask whether a table agrees with itself.
The specification
Three pages from the end of the book, after the last table and before the errata, there is a section headed Advertisements for the better understanding of the several Tables. It begins Concerning the Table of Casualties consisting of thirty Columns, and what follows is a specification: a clause for each block of columns, saying what is in it and why. Graunt wrote down what his instrument was supposed to do. So the sheet can be checked against its own description, clause by clause.
Two of the clauses are worth reading before the verdicts. This one is the reason for that odd sixth summary column, the one that adds three scattered years rather than four consecutive ones:
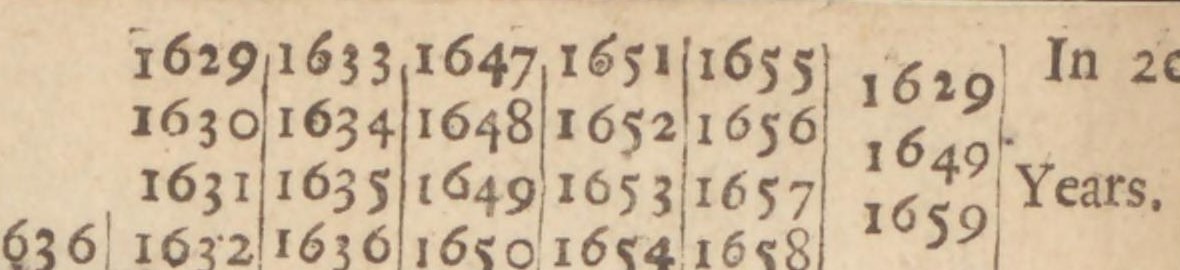
He is comparing three years taken at wide intervals against the whole twenty, to see whether the scattered years give the same answer as the full count. Then he does the sum: a third of the three-year total against a twentieth of the twenty-year total, 11396 against 11462. That is a sample checked against an enumeration, printed in 1662, with the working shown.
Graunt's description of his own table, checked against it
The table he made
The other famous thing in Graunt's book is nine numbers. Of 100 people conceived, he says, 36 die before the age of six, and then the survivors thin out decade by decade until one of them reaches 76. It is the first life table, and every actuarial table since is descended from it.
Unlike the Table of Casualties, it is not a record of anything. Graunt says so, in the sentence where he introduces it, and he says exactly how he got the numbers:
Graunt, sect. 9, spelling as transcribed from the 1662 sheet.
Six mean proportionals between 64 and 1 is a completely specified instruction. It means eight numbers in continued proportion: seven equal steps down from 64 to 1, so each step multiplies by the same ratio r, with 64 × r7 = 1. There is exactly one such sequence. Here it is, against the one he printed.
None of that is our discovery, and it would be dishonest to present it as one. That the printed sequence is in effect a constant multiplier of five eighths, and that the last two decades were run off arbitrarily to land the survivor on 1, was stated plainly by Bryan Benjamin in 1964, introducing the Institute of Actuaries' facsimile of the book. Others read it differently: Ptoukha in 1938 proposed a multiplier of 0.63, and Glass in 1950 proposed that Graunt interpolated by second differences rather than proportions. What is added here is only the exact arithmetic, put where you can operate it, and the observation that the six values he says he sought are calculable to any precision you like and are nowhere near the six he printed.
It is worth being clear about what that is and is not. Graunt did not fake his life table. He said what he was doing, he named the two observations it rests on, he admitted in the same breath that the result was practical rather than exact, and he printed enough for a reader in 1662 or in 2026 to check him. He was wrong about what he had done, in public, with the working attached. That is a different act from getting it right, and a very different act from concealing it.