The Verification Venue · two published records, one shortcut
Two Tables, Two Integrals
Two numbers strangers take on trust: the SPF printed on a bottle, and the safe internal temperature printed in a recipe. Both are published as thresholds. Both are really the value of an integral, and each has a textbook shortcut that cannot reproduce the official table it claims to summarise. Fit each shortcut here, as hard as it can be fitted. Then watch one inequality and three published cells rule out its entire family without fitting anything.
A threshold is the end of a path. The bacteria in a chicken breast are not killed by the number your thermometer shows at the moment you pull it out; they are killed by everything the meat did on the way there. The light your skin does not receive is not stopped by the number on the bottle; it is stopped by however much cream is actually sitting over each square millimetre. Both official numbers know this. Both are published as tables of a dose, and both tables come with a one-line formula that practitioners use to move off the printed rows.
This page does one thing to each formula: it fits it to its own official table, in front of you, and reports what the best fit the formula admits still cannot do. Then it stops fitting altogether, because the argument that actually settles it needs no parameters at all.
The first table, and why it has to be read by eye
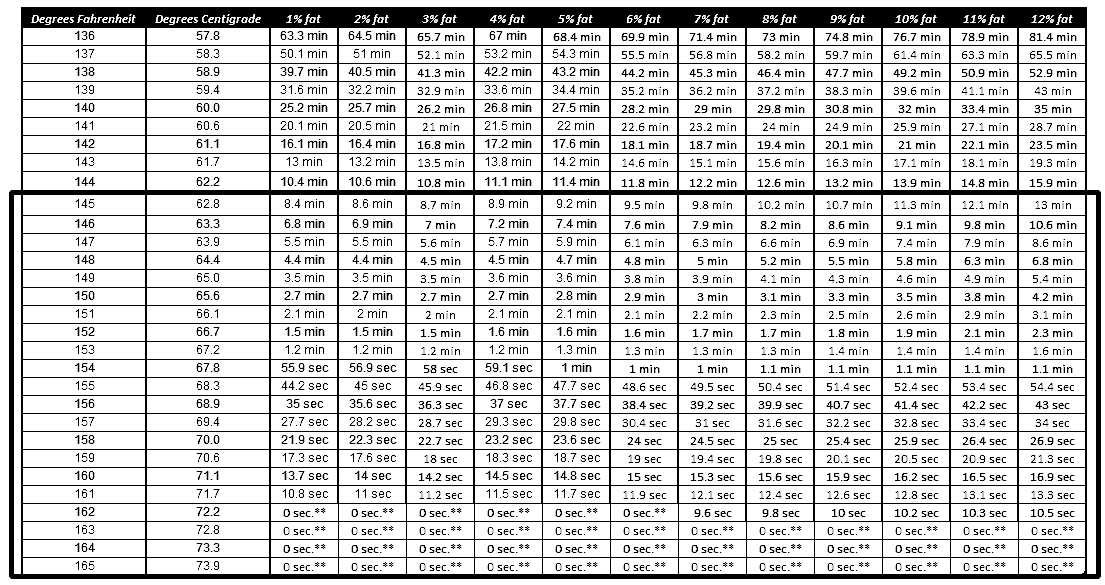
The United States Department of Agriculture publishes, in FSIS Cooking Guideline for Meat and Poultry Products (Revised Appendix A), a table of how long chicken must be held at each internal temperature to take Salmonella down by seven orders of magnitude. Thirty temperature rows from 136 to 165 degrees Fahrenheit, twelve fat columns from 1 to 12 percent, 360 cells, of which 318 carry a time and the rest say the reduction is instantaneous.
Tables 2, 3 and 4 of that document are raster images with no text layer. pdftotext returns the caption and the footnotes and nothing at all of the table body, and it does so without an error. There is one indexed bitmap per page: 1105 by 585 pixels at 113 ppi for the chicken table. So the table below was read the only way it can be read, by eye, twice, independently, and the two readings agree on all 360 cells. Then both tables were checked against a document that does have a text layer: Michigan State University Extension's transcription of the same FSIS poultry tables, which is behind a bot wall at its own address and reachable through the Internet Archive. All 720 chicken and turkey cells agree. Here is the bitmap itself, so you can check us too.
One convention has to be settled before any of this means anything. Forty-two of the chicken cells read 0 sec.**, and footnote 8 glosses that as a 7-log reduction achieved instantly. The MSU transcription of the same numbers prints <10.0 sec in those cells instead, and the table gives itself away: at 162 °F the 6 percent fat column reads zero while the 7 percent column reads 9.6 seconds, and continuing the trend of the five rows below puts the 1 percent cell at about 8.5 seconds. The zeros are a display floor near ten seconds, not an instant. They carry no time and are excluded from every fit and every test below.
The shortcut, and the table's own answer to it
Every food-safety textbook, every sous-vide guide and the free industry lethality spreadsheets all run the same first-order model. A population falls by a factor of ten every D minutes, and D itself falls by a factor of ten for every z degrees of extra temperature. Accumulated lethality over any temperature history is then one integral:
Everything in that formula rests on z being a constant of the organism. So ask the table. Take any two adjacent rows, divide the temperature step by the difference of the logarithms of the two times, and you have read a z straight off the published record, with no model and no fitting. The table prints its times to one decimal place, so each reading comes with an interval that the rounding cannot be blamed for. Drag along the rows.
Instrument 1 · the table's own z, row by row
Grey bars are what the printed rounding allows. The horizontal line is the single best-fit z for the whole column, found by least squares in log time at load. A constant of the organism would put every bar across that line. 8 pairs in this table are printed coarsely enough that their rounding lets the two times cross; those have no upper bound at all, the bar runs off the top, and they are never counted as excluding anything.
It does not. On the leanest column the single best-fit value is 9.780 °F, which is 5.433 °C, and the adjacent-row readings run from 6.84 to 10.90 °F. Rounding will not absorb that: 9 of the 25 adjacent-row intervals exclude the best-fit value outright.
Before anything is made of that, the fitter has to be shown to work. The z it returns is not a free-floating number; it has a published value to land on, from a paper this guideline itself cites. Juneja, Eblen and Marks (2001b) measured Salmonella survival in ground poultry and reported z = 5.5 °C for ground chicken and 6.1 °C for ground turkey, statistically significantly different. FSIS publishes a separate table for each bird for exactly that reason. Run the same unmodified fitter over both tables and it returns 5.433 and 6.090 °C: a miss of 1.21 percent on the chicken and 0.17 percent on the turkey, and the species difference tracked in the right direction and very nearly the right size. The lab and the table are measuring the same thing.
The second table is a single number on a bottle
A sun protection factor is defined by an integral too, and over a distribution that is visible to the naked eye: the film of cream is not the same thickness everywhere. If the absorber attenuates by exp(−A·d) through a thickness d, then what gets through the whole treated patch is the area average of that, and the factor is its reciprocal:
The number on the bottle is that quantity measured at one particular thickness. Both the ISO method and the US monograph apply the product at 2 mg/cm², a dose that survey after survey finds almost nobody applies. So how does the factor move when you apply less? The textbook answer treats the film as even, which turns the average into a single exponential and gives a rule with no free parameters at all once the label is fixed: halve the dose and take the square root, quarter it and take the fourth root. Faurschou and Wulf tested that in vivo in 2007 on twenty volunteers and reported that it held:
"The relation between the sunscreen amount applied and the SPF provided was most likely to follow exponential growth (r2 = 0.903). ... Application of 1 mg cm-2 or 0.5 mg cm-2 makes the SPF fall as the square or fourth root, respectively, and 4 mg cm-2 results in an almost squared SPF."
Faurschou & Wulf, Br J Dermatol 156:716 (2007). Decimal points restored; the MEDLINE record encodes them as a middle dot.
That study used one product, labelled SPF 4. Five years later Ou-Yang and colleagues ran the same experiment on six products labelled SPF 30 to 100, at 0.5, 1.0, 1.5 and 2.0 mg/cm², and got a different shape and a very different number. Their declared affiliation is Neutrogena, and their paper's stated conclusion is that sunscreens of SPF 70 and above add clinical benefit while SPF 30 and 50 "may not produce sufficient protection at actual consumer usage levels", which is a recommendation to buy the higher tier from a company that sells it. That is not a reason to throw the measurement away, and the two numbers below are the load-bearing ones on this half of the page, so the interest is named here rather than left for a reader to discover:
"There was a linear relationship between application density and the actual SPF ... Sunscreens labeled SPF 70 and 100 applied at 0.5 mg/cm2 provided an actual SPF value of, respectively, 19 and 27."
Ou-Yang, Stanfield, Cole, Appa & Rigel, J Am Acad Dermatol (2012), PMID 22463921.
The fourth-root rule, given the label, predicts 2.89 for that first product. The measurement is 19. Set the label and the dose and watch the two rules separate.
Instrument 2 · two published rules, one dose axis
Both curves are pinned to the label at 2 mg/cm², so at the right-hand edge they agree by construction and the comparison there is empty. The two crosses are Ou-Yang's published in-vivo values, which no curve here was fitted to.
Nothing about the film has been measured here, and nothing needs to be, because the even-film rule has no adjustable part. Given a label of 70, it predicts a quarter dose gives 2.89 and that is its final answer. To make it produce the 19 that was measured on human skin, the product would have to have tested at 130,321 at the reference dose, because 19 to the fourth power is what the rule requires. There is no such sunscreen.
Fit it as hard as you like
"Every model is an approximation. You have shown that two shortcuts are a few percent off their own tables. Fit the parameters properly and the gap closes. That is a calibration story, not a finding."
That objection is holding a specific model: the shortcut has the right shape, and the disagreement is an ordinary residual, small, unstructured, and removable by a better choice of parameters. It makes two predictions, and both can be checked against the published record rather than argued about.
First, if the shape is right, the residual should be inside the table's own printed rounding, and its sign should wander like a coin. Second, if there is any structure left, adding the one parameter the underlying paper actually asks for should absorb it: Juneja's abstract states the recipe plainly, that "the estimated lag time should be added to the product of 7 and the estimated asymptotic D-value." Fit both, here, and read the outcome.
Instrument 3 · the best fit the family can manage
Bars are the fitted model's error at each row, as a percentage of the published time. The pale band is what that cell's own printed rounding permits. Fits are run in your browser at the moment you change the control, by least squares in log time for one term and by a Nelder and Mead simplex from twelve starting points for two.
On the leanest column the least-squares fit lands at 9.780 °F and its worst error is 10.37 percent, at 149 °F, where the table says 210 seconds and the fit says 188.2. That cell is printed to a tenth of a minute, so its own rounding is worth 1.4 percent.
But least squares minimises the sum of the squared errors, not the largest one, so 10.37 percent is not the smallest worst error this family can manage, and a page that quoted it as the best possible fit would be overstating its own case by a third. Ask for the smallest worst error directly and the answer is 7.66 percent, at 9.819 °F. That is the exact minimax fit of the same two parameters, checked here against a grid search to make sure it is the global optimum and not a local one, and it is the honest number to argue with: no choice of D and z does better than that on this column. Nor is the leanest column the awkward one picked out to flatter the argument. Run the same minimax fit down all twelve fat columns and the best any of them manages is 6.94 percent, at 5 percent fat; the worst is far larger.
And the signs do not wander. There are 26 rows with a time in them, 17 errors of one sign and 9 of the other, and they fall in 3 runs. Three runs or fewer, from a coin, has probability one in 120,175. Refitting for the smallest worst error does not break the pattern up: 3 runs again, one in 25,300, and under that fit the error at 136 °F is 97 times that row's own printed rounding.
And the failure has an address. Take only the rows at or above 154 °F and fit them by themselves: the same unchanged routine returns 9.811 °F, which is 5.451 °C, and its worst error across that block is 0.20 percent, comfortably inside the printed rounding. The top of the table is a clean single-z law. The departure lives in the lower rows, and 149 °F, where the miss peaks, is 65.0 °C: the top of the temperature range Juneja actually measured. Above the measured range the table is the textbook formula. Inside it, it is not.
Now switch the family to two terms. The optimiser does not use the extra parameter: it drives the lag to zero, drives the two z-values onto each other, and returns the one-term fit with the same worst error to the last digit. That is not a numerical accident, and the reason is the whole of the next section.
Three cells, one inequality, no fitting
Write down every model of this shape at once. A time built as a sum of contributions, each of which falls log-linearly with temperature:
One term is the plain D and z rule. Two terms is Juneja's lag plus seven D, on the reading that his lag falls log-linearly with temperature as his D-value does, which is what every practitioner spreadsheet assumes and what his abstract implies without quite saying. More terms cover every variant of the practitioner recipe we could find. Every member of that family, at every possible setting of every parameter, has the same shape: plot the logarithm of the time against temperature and the curve is convex. That is not an approximation or a tendency. The logarithm of a sum of exponentials of affine functions is convex, always.
A convex curve never rises above a chord drawn between two of its own points. So pick any three rows of Table 3. If the middle time sits above the chord joining the outer two, by more than the printed rounding of those three cells can account for, then no member of that family passes through those three cells, at any parameters. Nothing is fitted, and there is no tolerance to argue over, because the table's own rounding is the tolerance.
Instrument 4 · pick three rows and let the inequality decide
Some choices land on cells with rounding wide enough to cover both answers. The instrument says so rather than guessing, and the tally of what it can and cannot decide is in the check panel below.
The strongest triple in the chicken table is at 12 percent fat: the rows at 136, 149 and 155 °F. The middle cell reads 5.4 minutes, so the published time is at least 321 seconds; every convex curve through the worst-case readings of the other two is capped at 225.3. That is an excess of 1.42 times, and it is not close. Sweeping all three-row combinations in every fat column, 15,420 of 33,150 triples violate convexity beyond the rounding, and 11,289 more cannot be decided either way. The turkey table, transcribed the same way and never used to reach this conclusion, does the same thing: 17,385 of 43,848.
One reading of the printing had to be chosen, and the generous one was taken. A cell printed 13 min with no decimal is treated here as anywhere from 12.5 to 13.5 minutes, the widest interval the printing allows. If instead the guideline is suppressing trailing zeros, so that 13 min means 13.0, every interval narrows and the count of violations rises to 16,683. The number printed above is the smaller of the two.
So the two-term fit did not fail to find the good parameters. There are none. The record and the recipe are different shapes.
The same inequality, on the bottle
The sunscreen shortcut has the identical property in a different coordinate, and it settles the argument in the literature in a way that fitting never could. Whatever the film looks like, the light that gets through is an average of exponentials, and the logarithm of that average is a convex function of the factor you scale the whole film by. Scale it to zero and there is no protection, which pins one end of the chord. Convexity then gives, for a film of any shape whatsoever:
One thing has to be assumed, and it is worth stating plainly rather than burying, because it is the only assumption in the argument and it can fail. The inequality scales a film. It says that if you take the film the label was measured on and make it s times thinner everywhere, the protection cannot fall below the label to the power s. It does not say what happens if applying less changes the shape of the film instead of its thickness, and applying less of a cream is exactly the situation in which a film is most likely to break up. Spread a quarter of the reference dose over half the area and leave the other half bare, and a labelled 50 comes out at 1.75, well under the floor of 2.66. The floor is a statement about thinning, not about coverage, and nothing on this page bounds the cost of a patch you missed. The check panel breaks it on purpose so that this is a measured limit and not a footnote.
With that said, the even-film rule is not an estimate of how much protection is lost to unevenness. It is the extreme case: among films that are thinned rather than broken up, it is the largest shortfall any geometry can produce, reached exactly when the film is perfectly even and never otherwise. That is why a measurement made on a labelled SPF 4 could not have settled anything about an SPF 70, and the instrument below is the reason: at a quarter dose the two rules are 1.24 times apart at label 4 and 6.31 times apart at label 70. An experiment on the first cannot see what happens to the second.
Instrument 5 · roughen the film and watch the floor hold
A gamma-distributed film has a closed form, SPF = (1 + A·μ·c²)^(1/c²), and this panel also integrates the same average numerically by a completely different algorithm; the check panel reports how far apart the two land. At a coefficient of variation of zero the film is even, the two rules coincide and the comparison is empty by construction. This control does not identify the film as the cause: a spread of absorbance across the erythema spectrum gives the same closed form with the same parameter, and dose-against-density data cannot tell the two apart.
One value of the roughness is worth naming, and worth being careful about. A coefficient of variation of exactly 1 is the exponential distribution of film thickness, and it makes the closed form collapse to SPF = 1 + A·μ, a straight line: the shape Ou-Yang reported. Fix the one remaining parameter from the label and the magnitude is then forced with nothing left to tune, because the quarter-dose value is exactly (label + 3) / 4. It comes out at 18.25 against a measured 19, and 25.75 against a measured 27, which is 3.9 and 4.6 percent out, while the rule it replaces is out by factors of 6.6 and 8.5. Do not read that as a prediction on products the model never saw. The shape came from Ou-Yang's own reported conclusion, so what has been checked is whether their stated linearity is consistent with their own two numbers once the line is pinned at the label and at no protection for no cream. It is, closely, and that is worth something; it is not an out-of-sample test, and there is only one parameter and one shape standing between the label and the answer.
Two records, two shortcuts, and one sentence covers both, but it is a smaller sentence than it looks. What the halves share is a shape, not a cause: each shortcut family is convex in its own natural coordinates, each official record sits on the other side of that convexity, and in both cases a single inequality settles it with nothing fitted. The causes are different and should not be run together. On the bottle it is a Jensen gap over the thickness of the film across the skin. On the table it is the shape of the survival curve at a constant temperature, which is not an average of anything over a distribution, and a spread in the bacteria's own heat resistance would bend that curve the other way. The idea both records really carry is the plainer one this page opened with: the threshold you were handed is the endpoint of a path, and the path decides.
The directions differ too, and on a food-safety page that has to be said out loud rather than smoothed away. Against the label, the even-film rule under-states what a real product delivers, so its error is alarmist. Against the guideline, the fitted shortcut is optimistic exactly where it gets used: with the column fitted by least squares, over 143 to 151 °F it asks for up to 10.37 percent less time than the table does, while over most of the rest of the column it asks for more. Refit for the smallest worst error and the optimistic band moves to 145 to 151 °F. There is no single direction to quote, and the sign depends on where the z was anchored.
These two subjects were screened separately, by reviewers who did not see each other's work, and the same objection came back from both: the published shortcut does not reproduce the published table. Independent agreement is not proof of anything, but it is the reason these two halves are one page.
What the table is, and what this page is not
This page issues no cooking advice, and nothing here says any temperature is safe. The finding is that a widely used formula fails to reproduce the government's table. Where they disagree, the table is the published standard and the formula is the thing under examination.
If anything, the disagreement runs the uncomfortable way. Over the band a slow cook actually passes through, the best-fit shortcut asks for less time than the guideline does, and the shortcut is also path-independent by construction, which means it assumes bacteria carry no memory of the heating they have already survived. Breslin and colleagues cooked inoculated whole-muscle roasts in a pilot oven to test exactly that and concluded that "slow-cooked roasts, processed to a computed lethality at or near that required by the regulatory performance standards, as calculated with a state-dependent model, may be underprocessed." Their path-dependent repair reduced the error in turkey and did not in beef or pork, so the size of the effect is unsettled; its direction is not.
Three things about Table 3 are easy to strip off and change what it means. Every row carries them and this page carries them too.
The consumer number is a margin, not a contradiction. A page that dragged a slider twenty degrees down this table and announced that the government disagrees with itself would be misreading the top of the column. Read upward instead: by 163 °F every fat level has dropped below the table's ten-second floor, and lean chicken is already there at 162 °F. The consumer figure of 165 °F sits 2 °F above the first row on which FSIS's own table stops printing a dwell time at all.
The times come with a humidity condition, and it binds hardest at the bottom of the table. Footnote 9 says that the boxed rows at or above 145 °F are eligible for Relative Humidity Options 1 and 2, which mean continuously injected steam or a sealed oven for half the cooking time or one hour, whichever is longer, and that all time-temperatures may apply Options 3 and 4 instead. That is an eligibility, not a restriction: a product taken to at least 145 °F plus the dwell time may use any of the four. The genuine restriction runs the other way and lands on the rows this page is most interested in, because a product cooked to an endpoint below 145 °F should select Option 3 or 4, ninety percent relative humidity for a quarter of the cooking time or an hour. Surface drying before the pathogens are destroyed raises their heat resistance, which is why the condition exists; the guideline also carries a section on the situations in which humidity is not needed, so "void without humidity" would be too strong. A dry home roast is still outside the validated process, not inside it.
Seven logs is a reduction, not a destination. The tables are a processing standard for ready-to-eat product made from a known starting population under a validated process. Seven orders of magnitude off an unknown number is still an unknown number. FSIS also recommends keeping the total time the product spends between 50 and 130 °F to six hours or less, for a separate reason entirely: Staphylococcus aureus grows in that window and the toxin it makes is not destroyed by any of the cooking parameters in the guideline.
And on the other table: none of this says a sunscreen is better than its label, or that applying less is fine. The film model here contains film geometry and nothing else. It has no rub-off, no sweat, no swimming, no photodegradation, no missed patches, and no ultraviolet A at all, which SPF does not measure. What it does say is narrower than it first sounds. The frightening version of the under-application story, the one where an SPF 50 becomes an SPF 2.7, is the worst case for a film that is thinned, not the middle of that range, and the direct in-vivo measurements on high-factor products come in well above it. But thinning is not the only thing that happens when someone uses too little. A film that goes patchy instead is outside the inequality altogether and can land below 2.7, and the check panel demonstrates exactly that rather than assuming it away. So the honest summary is that the fourth-root arithmetic is the wrong reason to be worried about under-application, and coverage is a better one.
The check
Everything below is computed in this browser at load from the transcription printed above and the film integrals, then compared against anchors that were fixed before any of it was run. Three of the lines exist to make the instruments go red on purpose. The last line is the one that catches a lying page: it reads every figure printed in this page's own prose back out of the document and compares it with the value just computed.
Offline, over the same data and by a partly different route: node research/the-two-tables/verify-the-two-tables.mjs.
What is exactly true here, what is a choice, and what is missing
Exactly true, and not a fit. The convexity of log Σ ck 10^(−(T−T_ref)/zk) and of log ⟨exp(−A s d)⟩ in s are both the standard convexity of a log-sum-exp, and both hold for every parameter setting. The three-cell test and the SPF floor follow from them with no estimation and no tolerance beyond the published rounding. The transcription's rounding is read from the printed number of decimals, so a cell reading "13 min" is treated as anywhere in 12.5 to 13.5 minutes and a cell reading "8.4 min" as 8.35 to 8.45, which is generous to the shortcut in both directions.
Free choices this page made. Fitting in log time weights the rows equally in relative error rather than absolute; a fit in linear time would be dominated by the hour-long rows at the bottom of the table and would look worse for the shortcut, not better. The two-term optimiser is a simplex from twelve starting points, so it can in principle miss a better optimum, which is why the convexity argument is the one the conclusion rests on. On the sunscreen side the gamma family is a choice: it is the family with a closed form, it contains the even film and the exactly-linear law as members, and the floor result does not depend on it, holding for every distribution. The absorber is treated as a single effective A, and this is the page's sharpest limitation. Real SPF integrates an erythema-weighted spectrum, and a spread of absorbance across that spectrum produces the mathematically identical closed form, with the spectral spread standing exactly where the roughness stands. The two are therefore indistinguishable from dose-against-density data alone. The roughness control must not be read as measuring the geometry of anything: it sets the one parameter that both mechanisms share. The floor survives that particular ambiguity, because it does not care which spread it is, but it does not survive a film whose shape changes with the dose, and that limit is stated where the inequality is, not here. The dose slider also stops at the reference dose, which is where the inequality stops holding: the same convexity that gives a floor below 2 mg/cm² gives a ceiling above it, and Faurschou's 4 mg/cm² arm, the point at which the two laws are furthest apart and the best place anyone could have tested them against each other, is off the right-hand edge of this instrument and out of reach of its abstract.
What is not here. No page of this can tell you what your own food or your own skin is doing. The chicken half is arithmetic about a published table and contains no microbiology of its own; the survival curves behind the table are Juneja's and we did not re-measure them. The sunscreen half rests on two abstracts, because the full texts are behind publisher walls: we have Ou-Yang's two reported values and not the underlying per-product curves, and we do not know the products' measured SPF at the reference dose as opposed to their labels. A named uncertainty rather than a hidden one: if a product labelled 70 actually tested at 80, the linear model's prediction moves from 18.25 to 20.75, while the fourth-root rule moves from 2.89 to 2.99. The gap does not come from that.
The transcription. Two independent visual readings of the same bitmap agreeing on 360 cells rules out a slip of the eye but not a systematic misreading of a glyph that both readings would share. The check that can catch that one is a transcription made by someone else from a text layer, and there is one: Michigan State University Extension published the same FSIS poultry tables in a document that has real text. Its own address answers a fetcher with an Incapsula interstitial, but the Internet Archive's copy resolves, and all 720 chicken and turkey cells agree with it. Backing that up are the Juneja anchor, which is sensitive to a whole column at once, and the turkey table, which was read separately and reproduces the same structure.
The one gap that could still matter, named rather than left to be found. The excluded family is every sum of log-linear terms, and the page says that Juneja's own "lag plus seven D" recipe is a member of it. That is true if the lag time, like the asymptotic D-value, falls log-linearly with temperature, which is the natural reading of the abstract and the form every practitioner spreadsheet uses. But the abstract states the arithmetic of the recipe without stating the lag's temperature dependence, and the full text is behind a publisher wall we did not get through. If Juneja's lag has some other form, a quadratic in temperature say, then it is outside the family and the convexity argument does not reach it. The argument against the plain D-and-z rule, which is the shortcut in general use and the one this page is about, is unaffected either way. This is the highest-value unopened item on the page.